
Mastering AKS Monitoring: Practical Journey with Azure Kubernetes Service

Ready to transform your data strategy with cutting-edge solutions?
Executive Summary
This project was all about setting up end-to-end monitoring for an AKS cluster. Over a few focused phases, I built the infrastructure, dashboards, alerts, troubleshooting workbooks, and validated everything with real-world tests. Along the way, I hit a few bumps (hello, schema mismatches), but also discovered some cool techniques for making monitoring actually useful.
Project Timeline
Phase 1: Infrastructure Setup (1.5 hrs)
- Created Resource Group: AKS-Monitoring-RG (East US)
- Log Analytics Workspace: MonitoringWorkspace
- AKS Cluster: MyAKSCluster
- 2 CPU nodes
- 1 GPU node pool (Standard_NC6)
- Deployed sample apps:
- Azure Voting App
- GPU test pod
Challenge: KQL queries failed because of schema differences
Win: Validated schemas + optimized queries = data flowing
Phase 2: Azure Dashboard (2.5 hrs)
Built 6 live dashboard tiles:
1. Cluster Health
2. Node CPU/Memory
3. Pod Restarts
4. App Errors
5. Latency vs Errors
6. Event Timeline
Challenges:
- Metrics looked different in InsightsMetrics vs Perf
- Column mismatches (ContainerName vs Name)
- Data lag messed up time comparisons
Wins:
- Standardized on Perf table for reliability
- Used getschema to double-check before writing queries
- Adjusted time ranges to smooth out delays

Live AKS monitoring dashboard. The 12.48K failed pods shown here are simulated failures to validate that our monitoring captures and displays error states - demonstrating the dashboard's ability to surface critical issues that need attention.
Phase 3: Alerts (1 hr)
Created an action group AKS-Alert-Notifications with email + Teams.
Alerts configured:
- CPU > 80%
- Pod Restarts > 10 in 5 mins
- App Errors > 15 in 2 mins
Validated with test notifications — alerts reached the right people.

AKS-Alert-Notifications action group configured with email + Teams integration.
Phase 4: Troubleshooting Workbook (1.5 hrs)
Made a hands-on workbook with 4 tabs:
- Node ↔ Pod Drilldown
- Pod-level Log Correlation
- GPU Metrics
- KQL Snippets (ready-to-use queries)
Cool feature: dynamic parameters passed between tabs → smooth troubleshooting.
Dynamic parameters in workbook allow node ↔ pod drilldown during troubleshooting.

Phase 5: Validation & Docs (2 hrs)
Ran tests to simulate issues:
kubectl run cpu-test --image=containerstack/alpine-stress --limits=cpu=2 -- --cpu 4
kubectl run error-generator --image=busybox -- /bin/sh -c 'while true; do echo "ERROR: test error"; sleep 5; done'
Simulated issues with stress pod, error generator, and pending pods to validate alerts and dashboards.

Gotchas:
- GPU node needed NVIDIA plugin
- Azure Vote frontend had a registry typo
- Stress pod required explicit CPU limits
Fixes:
- Corrected registry path
- Added pod limits
- Installed NVIDIA device plugin
Also created a runbook with:
- Dashboard guide
- Alert playbook
- KQL cheatsheet
- Maintenance checklist
Key Breakthroughs
- Schema Adaptation: Learned to handle differences (Perf vs InsightsMetrics, KubeEvents vs KubeEvents_CL).
- GPU Monitoring: Added custom tracking for GPU workloads.
- Cross-Resource Correlation: Linked infra metrics ↔ app logs ↔ alerts for faster RCA.
Lessons Learnt
- Metrics take 15–30 mins to show up — don’t panic too early.
- Always run getschema before building queries.
- Real-world testing catches the 'hidden' stuff (plugins, limits, typos).
- Dashboards are pretty, but workbooks are power tools for troubleshooting.
Final Architecture

AKS Monitoring Architecture – from cluster to dashboards, alerts, and troubleshooting workbooks.
Ready to Experience the Future of Data?
You Might Also Like

Snowflake recommends 100–250 MB files for optimal loading, but why? What happens when you load one large file versus splitting it into smaller chunks? I tested this with real data, and the results were surprising. Click to discover how this simple change can drastically improve loading performance.
Master the bronze layer foundation of medallion architecture with COPY INTO - the command that handles incremental ingestion and schema evolution automatically. No more duplicate data, no more broken pipelines when new columns arrive. Your complete guide to production-ready raw data ingestion
Learn Git and GitHub step by step with this complete guide. From Git basics to branching, merging, push, pull, and resolving merge conflicts—this tutorial helps beginners and developers collaborate like pros.

Discover how data management, governance, and security work together—just like your favorite food delivery app. Learn why these three pillars turn raw data into trusted insights, ensuring trust, compliance, and business growth.

A simple request to automate Google feedback forms turned into a technical adventure. From API roadblocks to a smart Google Apps Script pivot, discover how we built a seamless system that cut form creation time from 20 minutes to just 2.
My learning experience tracing how an app works when browser is refreshed

This is the first in a five-part series detailing my experience implementing advanced data engineering solutions with Databricks on Google Cloud Platform. The series covers schema evolution, incremental loading, and orchestration of a robust ELT pipeline.

Discover the 7 major stages of the data engineering lifecycle, from data collection to storage and analysis. Learn the key processes, tools, and best practices that ensure a seamless and efficient data flow, supporting scalable and reliable data systems.
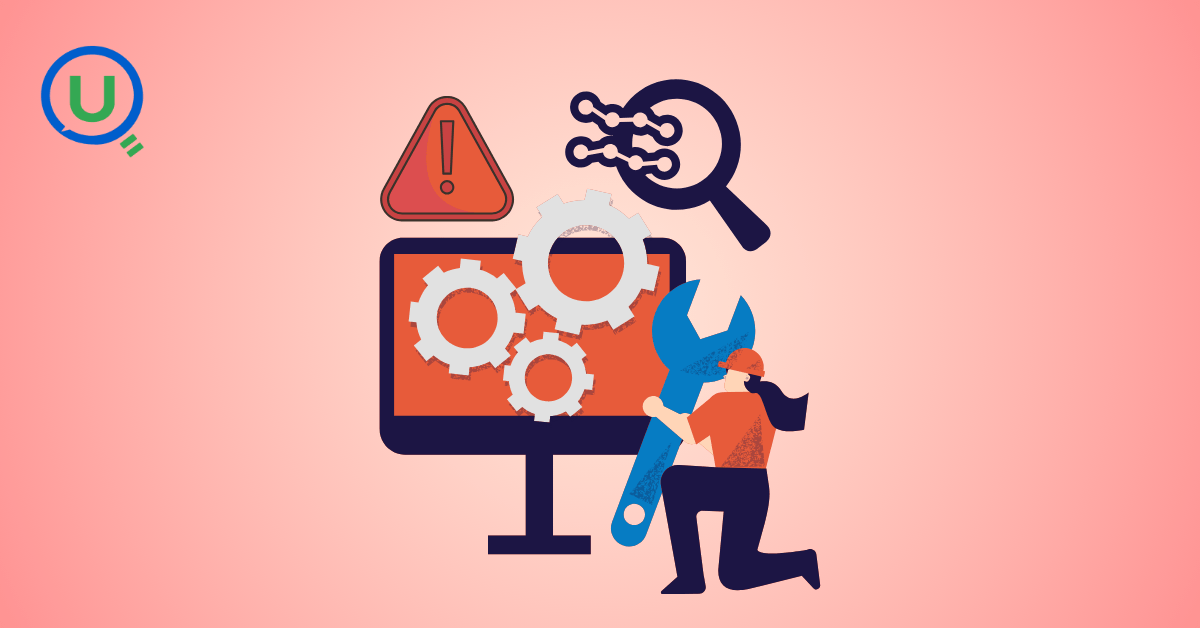
This blog is troubleshooting adventure which navigates networking quirks, uncovers why cluster couldn’t reach PyPI, and find the real fix—without starting from scratch.
Explore query scanning can be optimized from 9.78 MB down to just 3.95 MB using table partitioning. And how to use partitioning, how to decide the right strategy, and the impact it can have on performance and costs.
Dive deeper into query design, optimization techniques, and practical takeaways for BigQuery users.
Wondering when to use a stored procedure vs. a function in SQL? This blog simplifies the differences and helps you choose the right tool for efficient database management and optimized queries.
This blog talks about the Power Law statistical distribution and how it explains content virality

Discover how BigQuery Omni and BigLake break down data silos, enabling seamless multi-cloud analytics and cost-efficient insights without data movement.

In this article we'll build a motivation towards learning computer vision by solving a real world problem by hand along with assistance with chatGPT

This blog explains how Apache Airflow orchestrates tasks like a conductor leading an orchestra, ensuring smooth and efficient workflow management. Using a fun Romeo and Juliet analogy, it shows how Airflow handles timing, dependencies, and errors.

The blog underscores how snapshots and Point-in-Time Restore (PITR) are essential for data protection, offering a universal, cost-effective solution with applications in disaster recovery, testing, and compliance.
The blog contains the journey of ChatGPT, and what are the limitations of ChatGPT, due to which Langchain came into the picture to overcome the limitations and help us to create applications that can solve our real-time queries
This blog simplifies the complex world of data management by exploring two pivotal concepts: Data Lakes and Data Warehouses.

An account of experience gained by Enqurious team as a result of guiding our key clients in achieving a 100% success rate at certifications
demystifying the concepts of IaaS, PaaS, and SaaS with Microsoft Azure examples

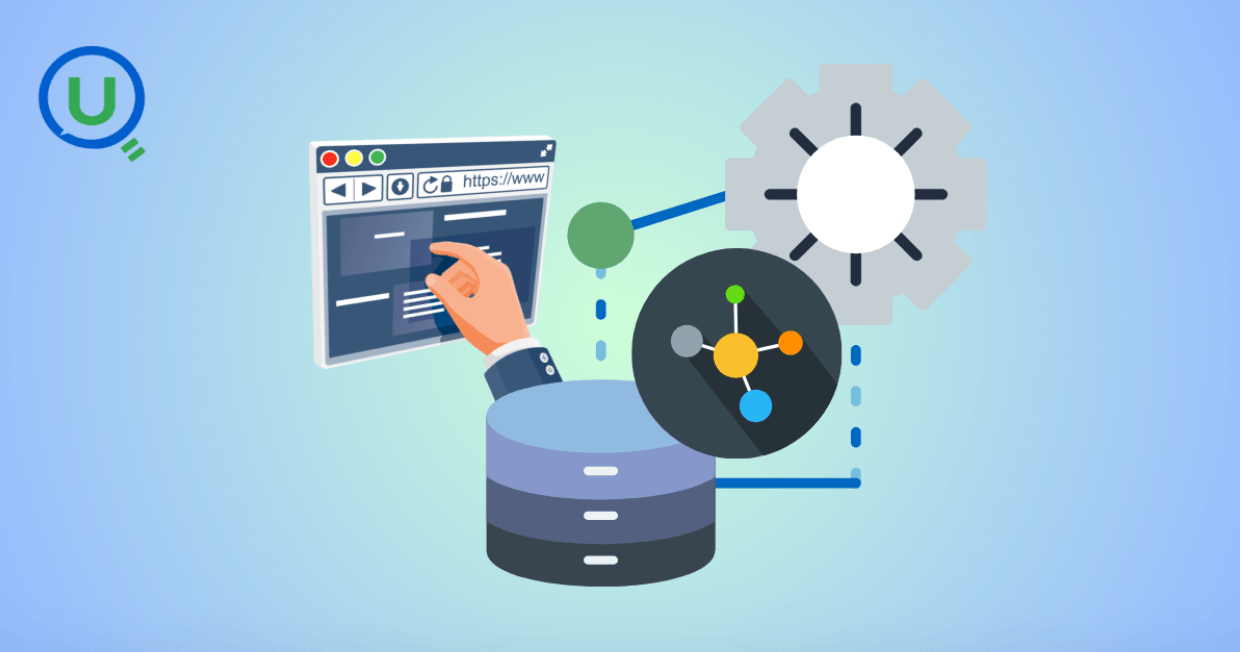
Discover how Azure Data Factory serves as the ultimate tool for data professionals, simplifying and automating data processes
Revolutionizing e-commerce with Azure Cosmos DB, enhancing data management, personalizing recommendations, real-time responsiveness, and gaining valuable insights.
Highlights the benefits and applications of various NoSQL database types, illustrating how they have revolutionized data management for modern businesses.
This blog delves into the capabilities of Calendar Events Automation using App Script.
Dive into the fundamental concepts and phases of ETL, learning how to extract valuable data, transform it into actionable insights, and load it seamlessly into your systems.

An easy to follow guide prepared based on our experience with upskilling thousands of learners in Data Literacy

Teaching a Robot to Recognize Pastries with Neural Networks and artificial intelligence (AI)

Streamlining Storage Management for E-commerce Business by exploring Flat vs. Hierarchical Systems

Figuring out how Cloud help reduce the Total Cost of Ownership of the IT infrastructure
Understand the circumstances which force organizations to start thinking about migration their business to cloud