
25 Business Intelligence Exercises to Boost Your Skills in 2025

Ready to transform your data strategy with cutting-edge solutions?
- Boost your Business Intelligence skills in 2025 with 25 hands-on exercises that cover data analysis, visualization, SQL, and more. Perfect for professionals looking to sharpen their BI expertise and stay ahead in the competitive job market.
In the rapidly evolving world of data, simply knowing how to use tools like Power BI, Tableau, or SQL isn’t enough to thrive. To truly stand out as a business analyst, data analyst, or BI developer, you must practice consistently and solve real-world problems. This is where business intelligence exercises become a game-changer.
Well-crafted business intelligence exercises challenge you to go beyond textbook knowledge. They sharpen your technical abilities, improve your data storytelling skills, and teach you how to make confident, data-driven decisions. These exercises mimic real business scenarios, allowing you to experience the nuances of analytical thinking, data modeling, visualization, and performance measurement.
Whether you’re a beginner looking to learn the ropes or a working professional aiming to upskill, regularly engaging in business intelligence exercises will give you an edge in 2025’s competitive job market. You’ll not only learn how to build dashboards but also understand what makes them impactful. You’ll connect metrics to business outcomes, identify trends, and offer insights that lead to strategic actions.
This blog features 25 business intelligence exercises designed to boost your analytical mindset and tool proficiency. From data cleaning and KPI dashboards to SQL analytics and predictive forecasting, each exercise is hands-on, practical, and aligned with the real demands of today’s business environments.
If you’re serious about mastering data analysis, make these business intelligence exercises a part of your weekly routine.

Module 1: Understanding the Data
1. Profiling a Sales Dataset
Load a sales dataset into Power BI or Tableau and examine its structure. Check for null values, incorrect data types, outliers, and inconsistencies. Use built-in tools to summarize key statistics like total revenue and unique customers. This step helps in understanding data quality before modeling.
2. Data Cleaning and Transformation
Clean messy data using Power Query or Tableau Prep. Perform operations like removing duplicates, fixing typos in product names, and parsing date formats. Use transformation steps like splitting columns and merging datasets. Clean data is the foundation of reliable analysis.
3. Understanding Data Granularity
Work with the same dataset at different aggregation levels: daily, weekly, and monthly. Create visualizations for each level and analyze how trends vary. This will help you understand how granularity impacts insights and decision-making. A useful skill for creating tailored dashboards.
Module 2: KPIs and Metrics
4. Designing KPIs for an E-commerce Business
Identify and calculate KPIs like Gross Margin, Conversion Rate, Average Order Value, and Repeat Purchase Rate. Understand the business logic behind each metric and how it contributes to decision-making. Create DAX formulas or calculated fields as needed.
5. Time-Based Metrics
Compute Month-over-Month (MoM), Year-over-Year (YoY), and 3-month rolling average for key metrics. Use time intelligence functions in DAX or Tableau. This teaches how to measure business growth and seasonal patterns over time.
6. Building a KPI Dashboard
Create a visually interactive dashboard with metric cards, trendlines, and color-coded alerts. Group KPIs into categories like Sales, Marketing, and Customer Success. Use slicers to make it dynamic and user-friendly. This dashboard becomes a one-stop view for stakeholders.
Module 3: Data Modeling and Relationships
7. Create a Star Schema
Model your data using fact and dimension tables (Sales Fact, Customer, Product, Region, Date). Create relationships using primary and foreign keys. A star schema simplifies querying and improves performance in BI tools.
8. Implement Row-Level Security
Add security rules so users only see data relevant to their region or department. For example, the North India Sales Manager should only view sales from their region. Learn to set up user roles and define filters accordingly in Power BI or Tableau.
9. Handling Slowly Changing Dimensions (SCDs)
Simulate a scenario where a product’s category changes over time. Apply Type 1 SCD (overwrite) or Type 2 SCD (track history). This ensures historical accuracy in reporting and helps in trend analysis over time.
Module 4: Data Visualization and Storytelling
10. Bar vs Line vs Scatter
Use a dataset to create bar, line, and scatter plots to represent the same data. Compare their effectiveness in communicating insights. Understand which chart best suits comparisons, trends, or relationships between variables.
11. Using Filters and Slicers
Add slicers and filters for category, region, and time to make your dashboard interactive. Enable the end-user to drill down into specific segments. Use bookmarks for toggling between different views or chart types.
12. Data Storytelling Challenge
Create a narrative using data - like how one region’s growth outpaced others due to better customer engagement. Combine visuals with annotations and title cards. Practice building stories that influence business decisions.
Module 5: SQL for BI
13. Joining Multiple Tables
Write SQL queries to join customers, orders, and product tables using INNER and LEFT joins. Extract key insights like customer purchase patterns or top products. Understanding joins is fundamental to working with normalized databases.
14. Window Functions
Use ROW_NUMBER(), RANK(), and LAG() to identify top N products per month or returning customers. These functions allow you to do advanced analytics like trend tracking and customer retention directly within SQL.
15. CTEs and Subqueries
Use Common Table Expressions and subqueries to simplify complex queries. For example, find customers who were active in the past but have churned recently. This helps in writing readable and reusable SQL queries.
Module 6: Real-World Dashboards
16. Executive Dashboard
Design a high-level dashboard showing KPIs like Total Revenue, Profit Margin, and YOY Growth. Keep it clean, visual, and informative. Executives need fast insights without details, so focus on clarity and impact.
17. Marketing Performance Dashboard
Track campaign performance through metrics like Impressions, CTR, CPC, and ROI. Show performance by channel (email, social media, ads). Use color and shape to highlight what’s working and what’s not.
18. Inventory Management Dashboard
Create visuals showing inventory turnover, slow-moving stock, and reorder alerts. Highlight potential stockouts and overstock areas. This helps logistics and warehouse teams make informed decisions.
Module 7: Predictive and Advanced Analytics
19. Forecasting with BI Tools
Use Power BI or Tableau’s built-in forecasting features to project sales or demand. Understand the assumptions behind models like exponential smoothing. Forecasting adds a future-looking capability to your dashboards.
20. Customer Segmentation
Apply clustering (e.g., K-Means via Python/R) to group customers by behavior - frequency, spend, or product preferences. Visualize the segments and explain how each group can be targeted differently.
21. Anomaly Detection
Identify unusual spikes or dips in metrics like daily sales or order count. Use statistical thresholds or machine learning libraries in BI tools or Python. Anomaly detection is crucial for fraud detection or error correction.
Module 8: Business Use Cases
22. Churn Analysis
Track how many customers stopped transacting over the past 6 months. Use features like days since last purchase, frequency of purchase, and complaints raised. Helps teams take preventive action to retain users.
23. Campaign ROI Tracker
Measure ROI across campaigns and regions. Compare cost vs. conversion value and optimize budget allocation. Allow “what-if” analysis by letting users adjust budget scenarios.
24. Store Performance Comparison
Compare sales, footfall, and conversion across multiple physical stores or regions. Use heatmaps, bar charts, and KPIs to highlight underperformers or best locations. Retail chains use this insight for expansion or training decisions.
Module 9: Final Integration Task
25. End-to-End Project
Choose a dataset from Kaggle or data.gov. Perform data cleaning, modeling, metric creation, and dashboarding from scratch. Package and present it like a portfolio project. This solidifies your learning and helps in job interviews.
Importance of Business Intelligence Exercises
In today’s data-driven world, Business Intelligence (BI) is the backbone of informed decision-making. It empowers businesses to gather, analyze, and visualize data in a way that drives strategic action. However, mastering BI tools and concepts takes more than just theoretical knowledge. This is where Business Intelligence exercises come into play.
These exercises are crucial for both budding and experienced professionals looking to sharpen their BI skills.
1. Practical Skill Development
BI tools like Power BI, Tableau, and SQL require hands-on experience for mastery. Business intelligence exercises provide an opportunity to practice these tools in real-world scenarios. Whether it’s creating interactive dashboards, performing complex data analysis, or cleaning messy datasets, these exercises give you the experience necessary to tackle actual business problems.
2. Understanding Data Flow and Relationships
Effective BI isn’t just about having a dataset - it’s about understanding how to manage and manipulate that data. Business Intelligence exercises enable you to grasp how data flows through a system, how to establish meaningful relationships, and how to design models that make data more usable and insightful. This knowledge is essential for building robust BI systems and drawing accurate conclusions.
3. Enhanced Decision-Making
At the core of BI is the ability to make data-driven decisions. Through Business Intelligence exercises, you will learn how to analyze data, identify patterns, and provide actionable insights. These exercises train you to think critically, helping you make better business decisions based on data, rather than intuition or guesswork.
4. Data Visualization Mastery
Data visualization is a powerful tool in BI, but creating effective visualizations requires practice. Business intelligence exercises help you hone your ability to select the right type of visualization for different data sets, ensuring that your audience can understand and make use of the insights you present. Whether it’s creating dashboards, designing reports, or telling a data story, these exercises build your visualization skills.
5. Keeping Up with Industry Trends
The BI field is constantly evolving with new tools, technologies, and best practices. Business Intelligence exercises help professionals stay current with these changes. By working through exercises that simulate real business environments, you can stay ahead of trends, apply new techniques, and be prepared for the latest BI innovations.
Final Words
These 25 business intelligence exercises are crafted not just for practice but for mastery. They simulate real business problems and offer opportunities to think like a BI consultant, not just a report builder. Whether you’re aiming for career growth, transitioning roles, or preparing for a certification - these exercises are your 2025 roadmap to BI excellence.
At Enqurious, we believe in learning by doing. Our hands-on labs and problem-solving journeys are designed to build job-ready BI professionals. If you’re looking to practice exercises like these in an industry-relevant context with expert guidance, Enqurious is the place to start.
Talk to our expert today!
Frequently Asked Questions (FAQ)
1. Why are Business Intelligence exercises important?
Business Intelligence (BI) exercises are essential for developing practical skills in data analysis, visualization, and reporting. They provide hands-on experience with BI tools and techniques, enabling professionals to solve real-world business problems, make data-driven decisions, and improve operational efficiencies.
2. What tools should I focus on for BI exercises?
For BI exercises, tools like Power BI, Tableau, SQL, Excel, and Google Data Studio are widely used. Learning how to manipulate data, create visualizations, and build interactive dashboards in these tools is highly valuable for enhancing your BI skill set.
3. Can I practice BI exercises without prior experience?
Yes, you can start with beginner-friendly exercises that focus on fundamental concepts like basic data manipulation, simple visualizations, and SQL queries. As you gain confidence, you can progress to more advanced topics like data modeling, predictive analytics, and automated reporting.
4. How can Business Intelligence exercises help in decision-making?
BI exercises help you develop the ability to analyze data, recognize trends, and extract actionable insights. By practicing these skills, you can make better decisions, predict future trends, optimize business processes, and solve complex challenges.
5. What is the role of data visualization in BI exercises?
Data visualization is a crucial aspect of BI, as it helps present complex data in an understandable and accessible manner. BI exercises that focus on visualization teach you how to choose the right chart types, design interactive dashboards, and effectively communicate insights to stakeholders.
6. How do BI exercises help me stay updated with industry trends?
The BI field is constantly evolving with new tools, techniques, and best practices. Regularly practicing BI exercises helps you stay current by allowing you to apply new features, methodologies, and tools in real-world scenarios, keeping you ahead of industry trends.
8. How often should I practice BI exercises?
Consistency is key. Practicing BI exercises a few hours each week will help you build your skills over time. Start with small exercises and gradually increase the complexity as you get more comfortable with different tools and concepts.
9. Can BI exercises be tailored to specific industries?
Yes, BI exercises can be customized for different industries like healthcare, retail, finance, and marketing. Tailoring your exercises to industry-specific data and challenges helps you apply your BI skills to real-world business scenarios and gain industry-relevant expertise
You Might Also Like
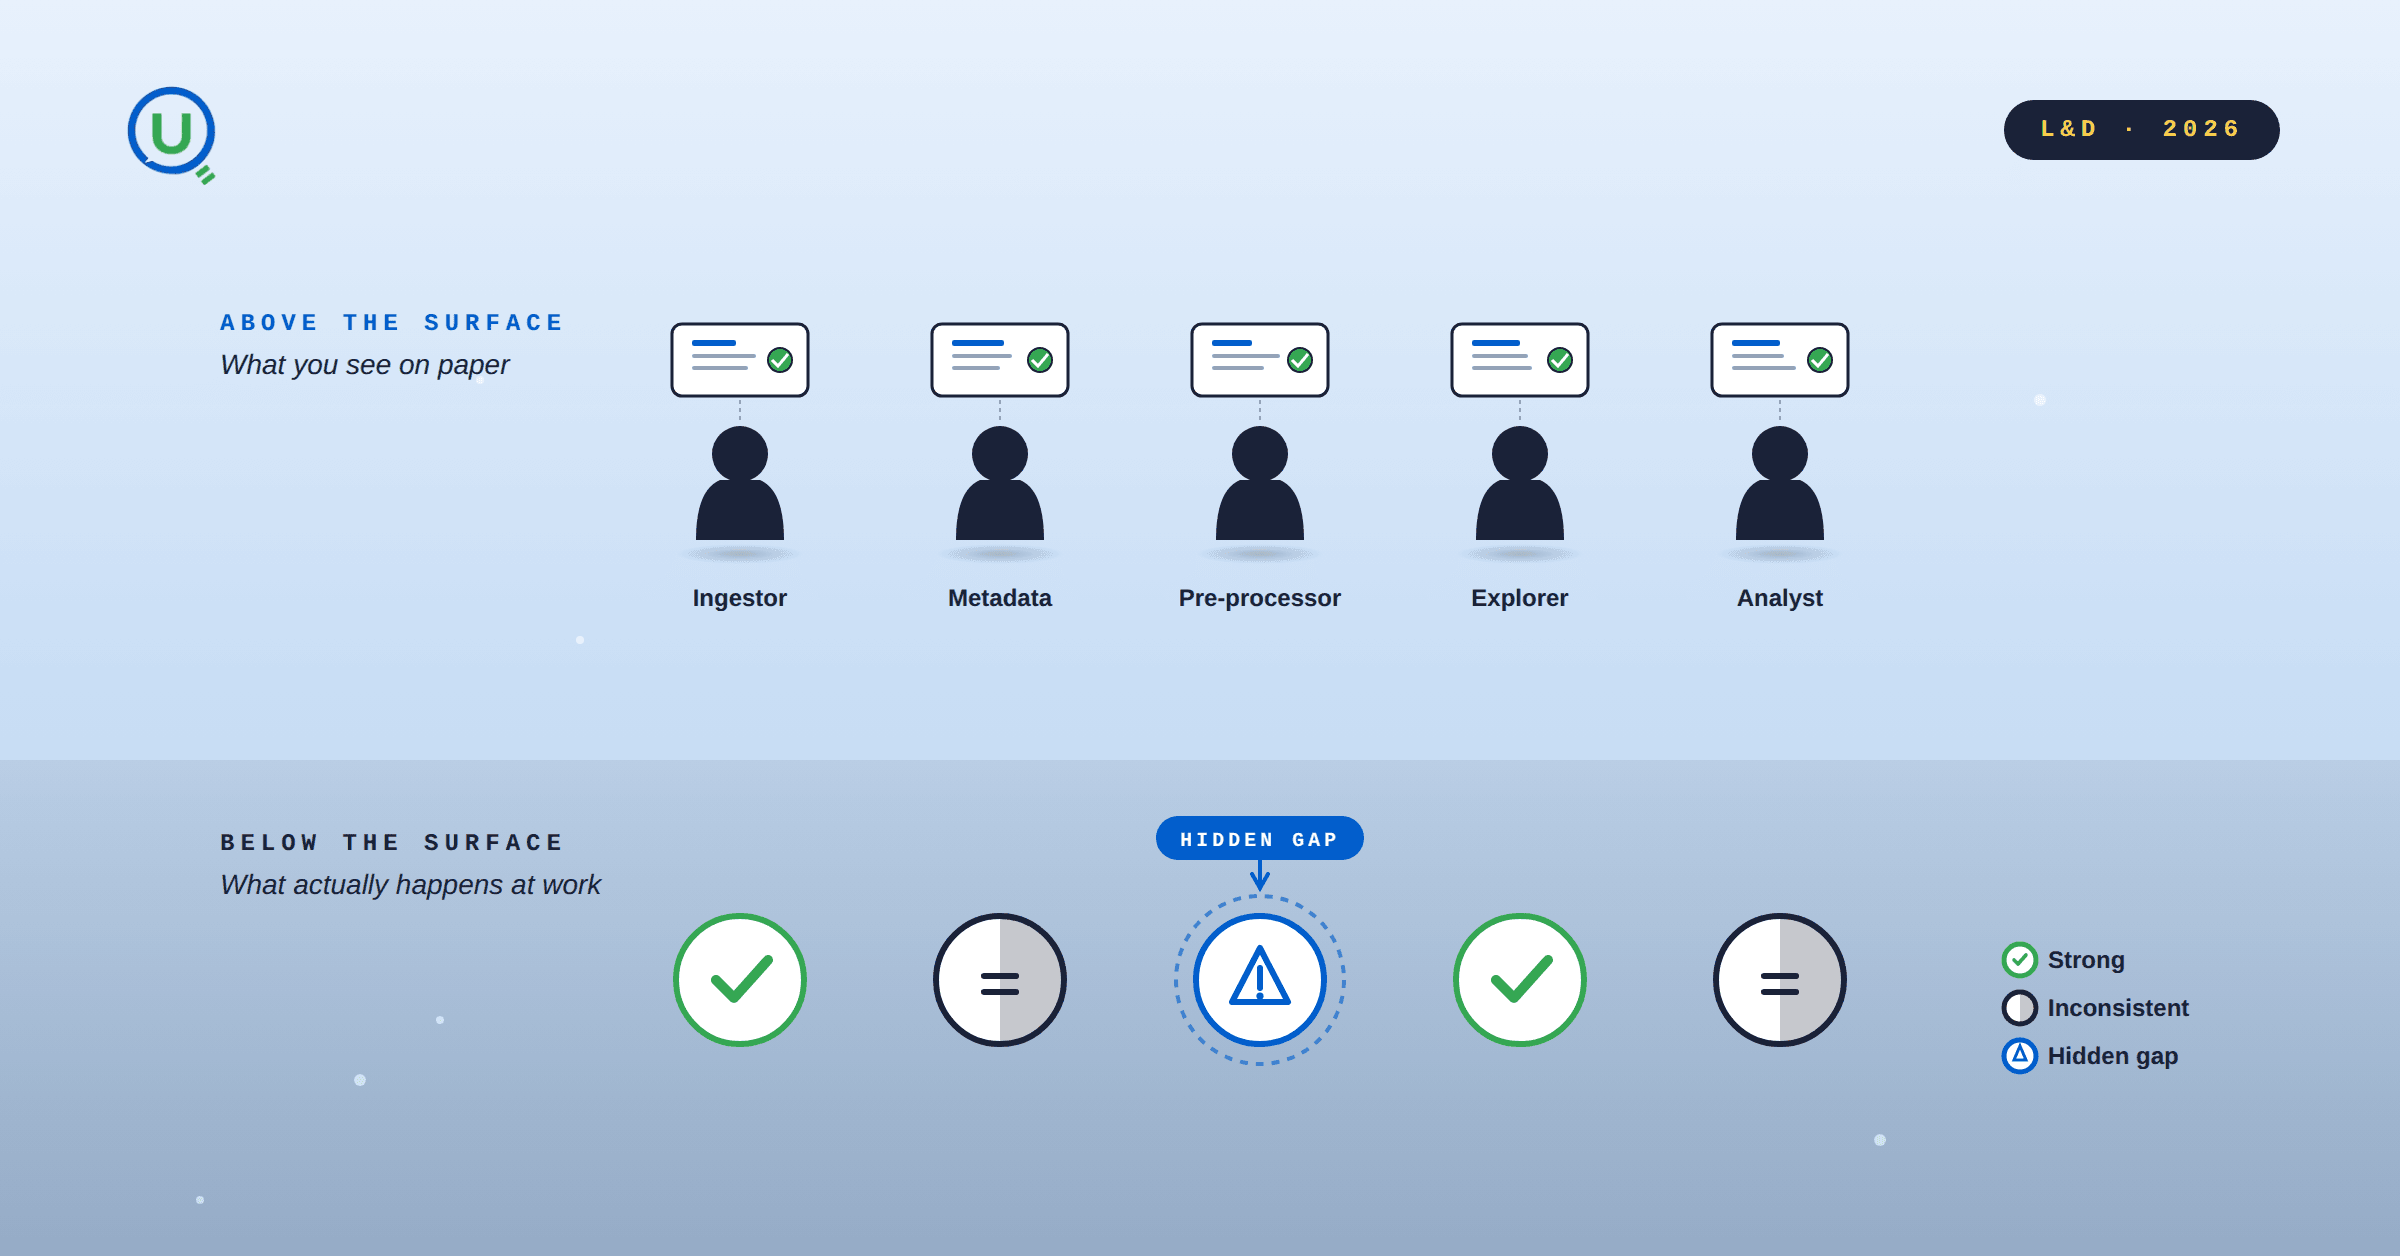
Skill gaps in data teams rarely show up in surveys or certifications. They show up when someone calls pd.read_csv on a .xlsx file. Three methods to make competence observable, not self-reported.

Spark optimization isn't always complex; some tweaks have a huge impact. Inferring schemas forces Spark to scan your data twice, slowing ingestion and inflating cost. Explicit schemas avoid the extra pass and make pipelines faster and cheaper.

A practical walkthrough of how I reduced heavy batch workloads using Change Data Feed (CDF) in Databricks. This blog shows how CDF helps process only updated records, cutting compute costs and boosting pipeline efficiency.

Why DELETE isn’t enough under GDPR, and how Time Travel can make sensitive data reappear unless VACUUM is used correctly.

A complete guide to building a future-ready L&D team in 2025. Explore the roles, skills, structure, and AI-driven strategies that drive real business impact.

Learn how to bridge the digital skills gap with effective upskilling strategies. Discover how to foster a culture of continuous learning, personalize training with AI, and focus on future-ready skills.

Discover 5 key strategies to overcome upskilling and reskilling challenges in the age of AI. Learn how to build a future-ready workforce with personalized learning, cross-functional collaboration, and real-world application.

Explore the key differences between LXP and LMS platforms and learn which is best for your business in 2025. Discover how AI-driven learning systems can boost employee engagement and upskill your workforce for the future.

Discover 6 powerful ways to upskill employees and future-proof your workforce in the age of AI and data. Learn how leading organizations are adapting learning strategies to stay ahead.

Explore the difference between reskilling and upskilling and why it matters for career growth and organizational success. Learn how reskilling helps workers pivot to new roles and how upskilling enhances current skills to stay competitive in today's fast-changing job market.

Explore the 6 core adult learning principles and how they can transform your training programs. Learn how to apply these principles for better engagement, retention, and real-world application, ensuring meaningful learning experiences for adult learners.

Discover the 9 key components of an effective learning experience and how they drive better engagement, retention, and real-world application. Learn how organizations can implement these elements to create impactful learning journeys.

Learn about Learning Management Systems (LMS), their key benefits, and popular examples like Moodle, Google Classroom, and Enqurious. Discover how LMS platforms are revolutionizing education and training for businesses and schools.

Discover how AI is transforming workplace learning and development by personalizing training, delivering real-time feedback, and aligning learning with business goals to drive workforce excellence and growth.

Discover why a Capstone Project is essential in 2025. Explore how it bridges the gap between theory and practice, enhances problem-solving skills, provides industry experience, and prepares students for real-world challenges. Learn how capstone projects are shaping future careers.

In today’s rapidly evolving job market, the value of evidence-based skills has never been more critical. As industries shift and technology transforms how we work, the need for tangible proof of competencies has become paramount.

In today’s rapidly evolving technological landscape, one skill stands out above all others: learnability. Learnability, often described as the ability to continuously acquire new skills and adapt to change, is no longer just an advantage but a necessity.

To build a future-ready workforce, companies need to rethink talent strategies. Start by developing a data-driven talent system to align key roles with best-fit talent. Invest in AI training now to stay ahead, and shift hiring practices to focus on skills, not just job titles.

At Enqurious, we understand the importance of empowering workforces with the right skills to navigate emerging challenges. Enqurious works as a strategic partner to supplement and enhance L&D Teams.
Understanding how variables work together can supercharge your marketing strategy.

Marketing Effectiveness: Strategies, Channels, and ROI Maximization

The transformative journey of the energy sector: from outdated practices to a data-driven revolution.

Enhancing Readability for Effective Learning and Development

This guide helps to understand what elements come together to make or break a visual

Thoughtfully crafted instruction design with drops of ambiguity and room for creative thinking makes the learning experience more enjoyable and “real world”.

Even after putting the best of the content, infrastructure and people, the gap between the intention of organizations to foster a culture of learning and the actual implementation and adoption of learning initiatives by employees keeps on widening.

Understanding why it is so important to nurture self driven learners in a fast paced technology world

Leveraging data to design better and efficient L&D strategy for organization success