
What Is Power BI And How Does It Work? A Beginner’s Guide
Ready to transform your data strategy with cutting-edge solutions?
In today’s data-driven world, businesses of all sizes are constantly seeking ways to better understand their data, make smarter decisions, and uncover insights that drive growth. Among the most powerful tools available for turning data into actionable insights is Power BI, Microsoft’s flagship business intelligence platform. If you're just starting out or trying to understand how it works, this guide will walk you through everything you need to know.
In this beginner-friendly blog, we’ll explore what is Power BI, how it works, its components, key features, and real-world applications. Whether you're a student, data enthusiast, or business owner, this article will give you a solid foundation to begin your journey into data visualization and business intelligence with Power BI.
Understanding what is Power BI
So, what is Power BI? At its core, Power BI is a suite of business analytics tools developed by Microsoft that enables users to visualize data, share insights, and make data-driven decisions. It transforms raw data into interactive dashboards and reports, making it easier for anyone – even non-technical users – to understand and explore their data.
Power BI connects to a wide range of data sources – from Excel spreadsheets and SQL databases to cloud services like Azure, Google Analytics, and Salesforce. With its easy-to-use drag-and-drop interface, Power BI allows users to build dashboards and reports that are visually compelling and easy to interpret.
In simple terms, Power BI is a bridge between your raw data and your business insights.
Key components of Power BI
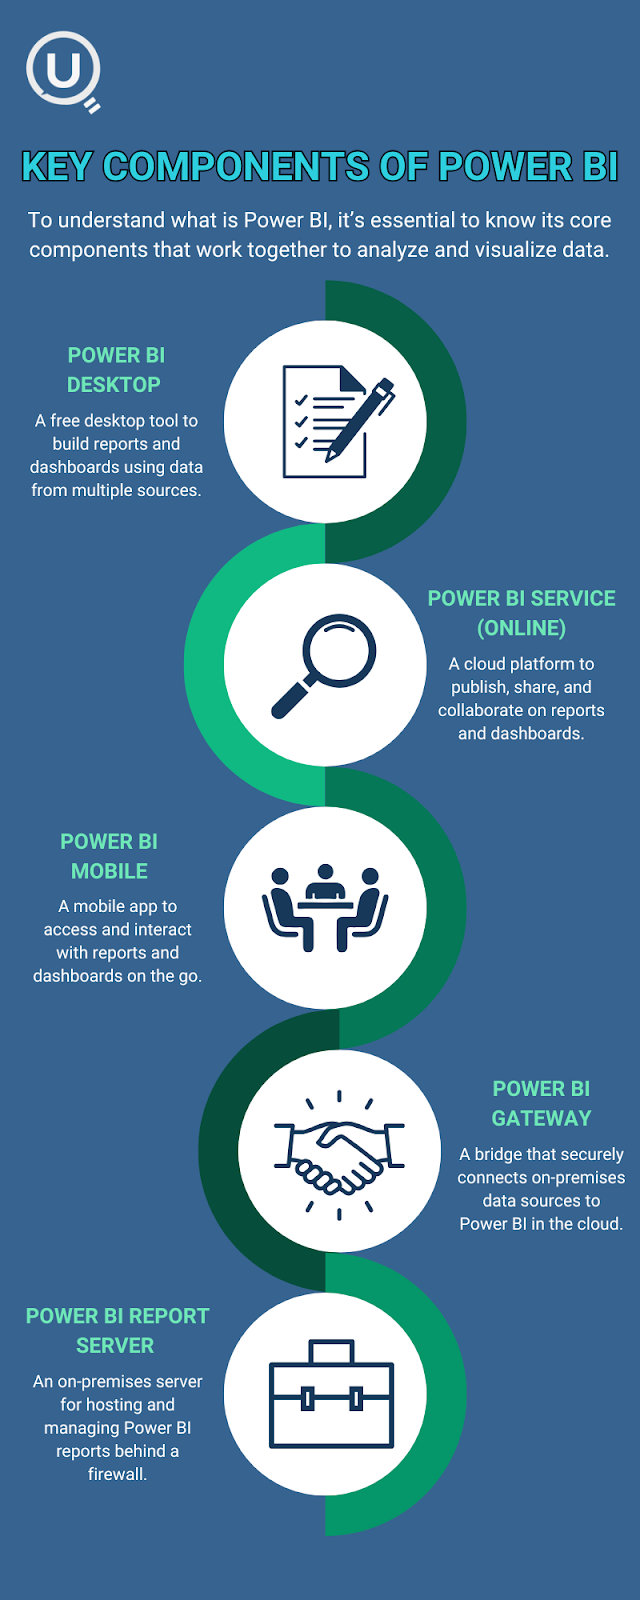
To fully grasp what is Power BI and how it functions, it’s important to understand its main components. Power BI is not a single tool but a collection of services and applications that work together to help users manage, analyze, and visualize data. Below are the main components:
1. Power BI Desktop
Power BI Desktop is a free application that users install on their local computer. It’s the primary development environment for creating reports and dashboards. Users can import data from multiple sources, clean and shape it using Power Query, and design visuals using a drag-and-drop canvas.
The Desktop version is ideal for data analysts and developers who want full control over report building. Once a report is ready, it can be published to the Power BI Service for sharing with others.
2. Power BI Service (Power BI Online)
This is a cloud-based platform where users can publish, share, and collaborate on reports and dashboards. After building reports in Power BI Desktop, you can publish them to the Power BI Service to be accessed from any web browser. The online service also offers features like scheduled data refresh, dashboards, natural language queries (Q&A), and user-based access control.
It allows for enterprise-level sharing and governance, making it suitable for large organizations.
3. Power BI Mobile
The Power BI Mobile app is available for iOS and Android devices. It lets users view and interact with dashboards and reports on the go. Whether you're in a meeting, traveling, or just away from your desk, you can stay connected to your data anytime, anywhere.
4. Power BI Gateway
For businesses that store data on-premises (rather than in the cloud), the Power BI Gateway allows secure data transfer between your local servers and Power BI Service. There are two types of gateways: Personal and Enterprise. The Personal Gateway is suitable for individual users, while the Enterprise Gateway is designed for larger, organization-wide data connections.
5. Power BI Report Server
This is an on-premises report server where you can publish Power BI reports within your organization's firewall. It’s an ideal solution for companies that have strict data security or regulatory requirements.
Understanding these components helps demystify what is Power BI and illustrates how it offers flexibility for different types of users and organizations.
How Power BI works: Step-by-step explanation
Now that we understand what is Power BI, let’s look at how it actually works from start to finish. Here’s a simplified breakdown of the Power BI workflow:
1. Connect to data sources
Power BI supports a wide variety of data sources – more than 100 connectors – including Excel, CSV files, SQL Server, Oracle, SharePoint, Google Analytics, Salesforce, Azure, and many more. Whether your data lives on-premises or in the cloud, Power BI can likely connect to it.
This broad connectivity is one of Power BI’s biggest strengths.
2. Data transformation and modeling
Once the data is imported, Power BI allows users to transform and clean it using Power Query Editor. You can remove duplicates, filter rows, rename columns, split data, change data types, and much more – all without writing code. For advanced users, M and DAX languages are available for deeper customization.
After cleaning the data, users can build a data model by creating relationships between different data tables and defining measures or calculated columns.
3. Building visualizations
With clean and structured data, users can create visualizations using Power BI’s intuitive interface. These visualizations include bar charts, line graphs, pie charts, maps, KPIs, tables, and many others. You can simply drag and drop fields onto the canvas to build your reports.
Each visual is interactive and responds to user clicks, enabling drill-downs and dynamic filtering – a major advantage over static reports.
4. Publishing and sharing
Once a report is ready, it can be published to the Power BI Service. From there, users can:
Share reports with others
Create dashboards by pinning visuals from multiple reports
Set up data refresh schedules
Collaborate within workspaces
Embed reports in websites or apps
Many companies also embed Power BI dashboards into platforms like SharePoint or Teams, or even customer-facing applications via the Power BI API.
5. Real-time insights and alerts
Power BI allows for real-time data streaming and dashboard updates. For instance, a logistics company can monitor delivery statuses or inventory levels live using Power BI. Users can also set up alerts that notify them when key metrics cross a certain threshold.
Why use Power BI? Key benefits for businesses and beginners
Now that we’ve explored what is Power BI and how it works, let’s look at why so many individuals and companies are adopting it.
1. User-friendly interface
Power BI’s drag-and-drop features and clean interface make it easy for beginners to get started without needing a background in data science or programming.
2. Interactive visualizations
Unlike static tools like Excel, Power BI visuals are interactive. Users can click on data points to drill down into details or highlight related data across charts.
3. Integration with Microsoft ecosystem
Power BI integrates seamlessly with other Microsoft tools like Excel, Azure, SharePoint, and Teams. If your organization already uses Microsoft products, adopting Power BI is even more valuable.
4. Cost-effective
There’s a free version of Power BI Desktop, and the Power BI Pro license (for sharing and collaboration) is relatively inexpensive compared to other BI tools. This makes it an affordable option for small businesses and startups.
5. Scalable and enterprise-ready
Power BI is not just for small businesses. With features like Row-Level Security, data gateways, Azure integration, and premium licensing, it can scale to meet the needs of large enterprises.
6. Community and support
With millions of users worldwide, Power BI has a large community and wealth of online resources. Websites like Microsoft Learn and SQLBI.com provide tutorials, templates, and support to help users get up to speed quickly.
Real-world use cases of Power BI
To better understand what is Power BI, let’s look at how real businesses are using it:
1. Retail
Retail chains use Power BI to monitor daily sales, stock levels, and customer trends across stores. Dashboards provide quick insights into what’s selling and where inventory may need adjustment.
2. Healthcare
Hospitals use Power BI to track patient flow, bed occupancy rates, and treatment outcomes. Dashboards help improve operational efficiency and quality of care.
3. Marketing
Marketing teams analyze campaign performance, web traffic, lead conversions, and ROI using Power BI. With integrations like Google Analytics or HubSpot, marketers get a 360-degree view of their campaigns.
4. Manufacturing
Manufacturers use Power BI to monitor production efficiency, equipment downtime, and supply chain metrics. Live dashboards help plant managers make faster, data-informed decisions.
Common misconceptions about Power BI
Even though Power BI is growing in popularity, many beginners still have some common misconceptions:
“It’s only for data analysts.” Not true! With its easy interface, Power BI is suitable for business users, marketers, and even students.
“You need coding skills.” Power BI can be used without writing any code. However, advanced users can leverage DAX and M for custom needs.
“It’s too complex to learn.” While it has advanced features, beginners can start with simple datasets and build up gradually.
Understanding what is Power BI also involves clearing up these myths so more people can take advantage of its capabilities.
Final words
Power BI is a powerful, flexible, and user-friendly tool that makes business intelligence accessible to everyone. From connecting to a wide range of data sources to building interactive dashboards and sharing insights across your organization, Power BI covers the entire analytics lifecycle.
Whether you're a beginner exploring data visualization or a business professional looking to make smarter decisions, Power BI offers the tools you need to succeed.
If you’ve ever asked yourself “what is Power BI”, now you know — it’s a game-changer for how businesses interact with their data.
At Enqurious, we help individuals and businesses navigate the complex world of data, analytics, and business intelligence. Whether you’re just starting your data journey or want to implement tools like Power BI in your organization, our team of experts can guide you every step of the way.
We don’t just teach you tools — we help you apply them to solve real business challenges. From building custom dashboards to training your team, Enqurious is your partner in turning data into decisions.
Ready to make your data work for you? Let Enqurious help you unlock the full potential of Power BI and beyond. Talk to our expert today!
Ready to Experience the Future of Data?
You Might Also Like
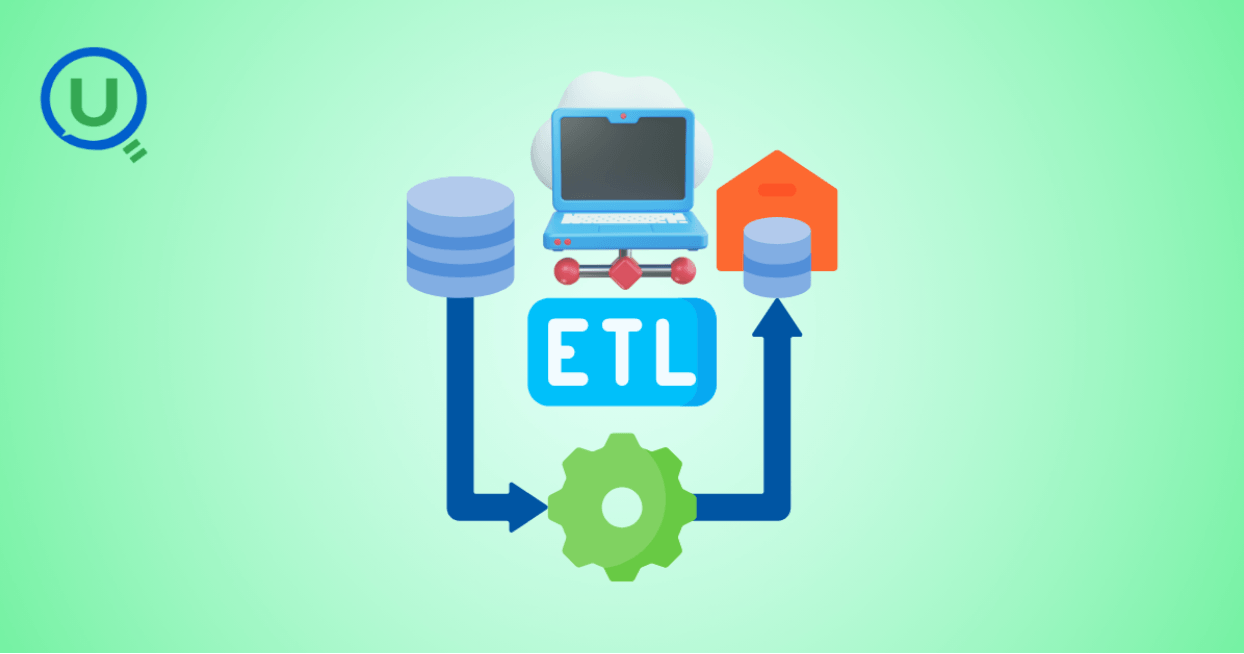
Learn the essential role of ETL (Extract, Transform, Load) in data engineering. Understand the three phases of ETL, its benefits, and how to implement effective ETL pipelines using modern tools and strategies for better decision-making, scalability, and data quality.

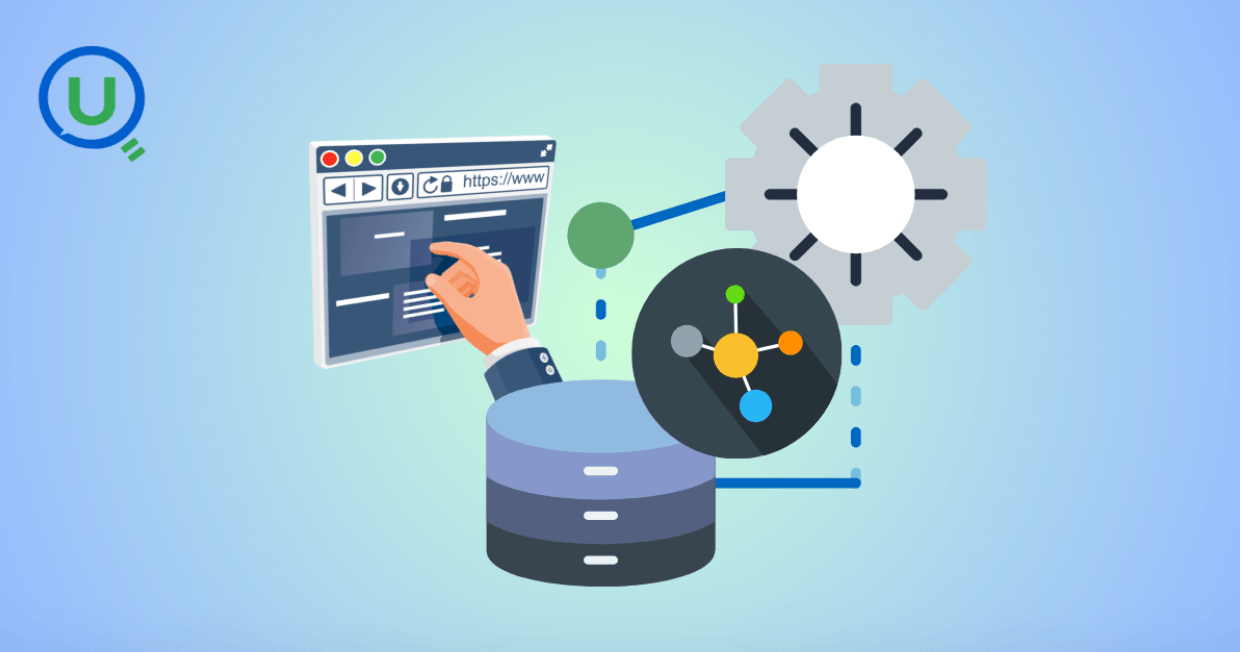
Discover why data orchestration and analysis are essential for modern data systems. Learn how automation tools streamline data workflows, boost insights, and scale with your business

Learn what a data ingestion pipeline is, why it's vital for modern analytics, and how to design scalable, real-time pipelines to power your data systems effectively.

Discover the top 15 data warehouse tools for scalable data management in 2024. Learn how to choose the right platform for analytics, performance, and cost-efficiency.

Confused between a data mart and a data warehouse? Learn the key differences, use cases, and how to choose the right data architecture for your business. Explore best practices, real-world examples, and expert insights from Enqurious.

Discover the top 10 predictive analytics tools to know in 2025—from SAS and Google Vertex AI to RapidMiner and H2O.ai. Learn why predictive analytics is essential for modern businesses and how to choose the right tool for your data strategy.

Explore the key differences between descriptive and predictive analytics, and learn how both can drive smarter decision-making. Discover how these analytics complement each other to enhance business strategies and improve outcomes in 2025 and beyond.

Explore the key differences between predictive and prescriptive analytics, and learn how both can drive smarter decisions, enhance agility, and improve business outcomes. Discover real-world applications and why mastering both analytics approaches is essential for success in 2025 and beyond.

Compare PostgreSQL vs SQL Server in this comprehensive guide. Learn the key differences, strengths, and use cases to help you choose the right database for your business needs, from cost to performance and security.

Explore what a Business Intelligence Engineer does—from building data pipelines to crafting dashboards. Learn key responsibilities, tools, and why this role is vital in a data-driven organization.
Discover why data lineage is essential in today’s complex data ecosystems. Learn how it boosts trust, compliance, and decision-making — and how Enqurious helps you trace, govern, and optimize your data journeys.
Learn what a data mart is, its types, and key benefits. Discover how data marts empower departments with faster, targeted data access for improved decision-making, and how they differ from data warehouses and data lakes.

Learn how to bridge the digital skills gap with effective upskilling strategies. Discover how to foster a culture of continuous learning, personalize training with AI, and focus on future-ready skills.

Discover 5 key strategies to overcome upskilling and reskilling challenges in the age of AI. Learn how to build a future-ready workforce with personalized learning, cross-functional collaboration, and real-world application.
Explore the key differences between LXP and LMS platforms and learn which is best for your business in 2025. Discover how AI-driven learning systems can boost employee engagement and upskill your workforce for the future.

Discover 6 powerful ways to upskill employees and future-proof your workforce in the age of AI and data. Learn how leading organizations are adapting learning strategies to stay ahead.

Master data strategy: Understand data mart vs data warehouse key differences, benefits, and use cases in business intelligence. Enqurious boosts your Data+AI team's potential with data-driven upskilling.
Learn what Azure Data Factory (ADF) is, how it works, and why it’s essential for modern data integration, AI, and analytics. This complete guide covers ADF’s features, real-world use cases, and how it empowers businesses to streamline data pipelines. Start your journey with Azure Data Factory today!
Discover the key differences between SQL and MySQL in this comprehensive guide. Learn about their purpose, usage, compatibility, and how they work together to manage data. Start your journey with SQL and MySQL today with expert-led guidance from Enqurious!
Learn Power BI from scratch in 2025 with this step-by-step guide. Explore resources, tips, and common mistakes to avoid as you master data visualization, DAX, and dashboard creation. Start your learning journey today with Enqurious and gain hands-on training from experts!

AI tools like ChatGPT are transforming clinical data management by automating data entry, enabling natural language queries, detecting errors, and simplifying regulatory compliance. Learn how AI is enhancing efficiency, accuracy, and security in healthcare data handling.
Big Data refers to large, complex data sets generated at high speed from various sources. It plays a crucial role in business, healthcare, finance, education, and more, enabling better decision-making, predictive analytics, and innovation.

Explore the difference between reskilling and upskilling and why it matters for career growth and organizational success. Learn how reskilling helps workers pivot to new roles and how upskilling enhances current skills to stay competitive in today's fast-changing job market.

Discover the power of prompt engineering and how it enhances AI interactions. Learn the key principles, real-world use cases, and best practices for crafting effective prompts to get accurate, creative, and tailored results from AI tools like ChatGPT, Google Gemini, and Claude.

Explore the 6 core adult learning principles and how they can transform your training programs. Learn how to apply these principles for better engagement, retention, and real-world application, ensuring meaningful learning experiences for adult learners.

Discover the 9 key components of an effective learning experience and how they drive better engagement, retention, and real-world application. Learn how organizations can implement these elements to create impactful learning journeys.

Boost your Business Intelligence skills in 2025 with 25 hands-on exercises that cover data analysis, visualization, SQL, and more. Perfect for professionals looking to sharpen their BI expertise and stay ahead in the competitive job market.

Learn what a Logical Data Model (LDM) is, its key components, and why it’s essential for effective database design. Explore how an LDM helps businesses align data needs with IT implementation, reducing errors and improving scalability.

Discover the power of a Canonical Data Model (CDM) for businesses facing complex data integration challenges. Learn how CDM simplifies communication between systems, improves data consistency, reduces development costs, and enhances scalability for better decision-making.

Learn about Learning Management Systems (LMS), their key benefits, and popular examples like Moodle, Google Classroom, and Enqurious. Discover how LMS platforms are revolutionizing education and training for businesses and schools.

Discover the 10 essential benefits of Engineering Data Management (EDM) and how it helps businesses streamline workflows, improve collaboration, ensure security, and make smarter decisions with technical data.

Explore how vibe coding is transforming programming by blending creativity, collaboration, and technology to create a more enjoyable, productive, and human-centered coding experience.
Learn how Azure Databricks empowers data engineers to build optimized, scalable, and reliable data pipelines with features like Delta Lake, auto-scaling, automation, and seamless collaboration.

Discover how AI is transforming workplace learning and development by personalizing training, delivering real-time feedback, and aligning learning with business goals to drive workforce excellence and growth.

Explore the top 10 data science trends to watch out for in 2025. From generative AI to automated machine learning, discover how these advancements are shaping the future of data science and transforming industries worldwide.

Discover why a Capstone Project is essential in 2025. Explore how it bridges the gap between theory and practice, enhances problem-solving skills, provides industry experience, and prepares students for real-world challenges. Learn how capstone projects are shaping future careers.

Discover the key differences between data scientists and data engineers, their roles, responsibilities, and tools. Learn how Enqurious helps you build skills in both fields with hands-on, industry-relevant learning.
Discover the 9 essential steps to effective engineering data management. Learn how to streamline workflows, improve collaboration, and ensure data integrity across engineering teams.
Azure Databricks is a cloud-based data analytics platform that combines the power of Apache Spark with the scalability, security, and ease of use offered by Microsoft Azure. It provides a unified workspace where data engineers, data scientists, analysts, and business users can collaborate.

In today's data-driven world, knowing how to make sense of information is a crucial skill. We’re surrounded by test scores, app usage stats, survey responses, and sales figures — and all this raw data on its own isn’t helpful.

In this blog, we will discuss some of the fundamental differences between AI inference vs. training—one that is, by design, artificially intelligent.

This guide provides a clear, actionable roadmap to help you avoid common pitfalls and successfully earn your SnowPro Core Certification, whether you’re making a career pivot or leveling up in your current role.

"Ever had one of those days when you’re standing in line at a store, waiting for a sales assistant to help you find a product?" In this blog we will get to know about -What is RAG, different types of RAG Architectures and pros and cons for each RAG.
Discover how Databricks and Snowflake together empower businesses by uniting big data, AI, and analytics excellence

How do major retailers like Walmart handle thousands of customer queries in real time without breaking a sweat? From answering questions instantly to providing personalized shopping recommendations, conversational AI reshapes how retailers interact with their customers.

In today’s rapidly evolving job market, the value of evidence-based skills has never been more critical. As industries shift and technology transforms how we work, the need for tangible proof of competencies has become paramount.

In today’s rapidly evolving technological landscape, one skill stands out above all others: learnability. Learnability, often described as the ability to continuously acquire new skills and adapt to change, is no longer just an advantage but a necessity.

To build a future-ready workforce, companies need to rethink talent strategies. Start by developing a data-driven talent system to align key roles with best-fit talent. Invest in AI training now to stay ahead, and shift hiring practices to focus on skills, not just job titles.
At Enqurious, we understand the importance of empowering workforces with the right skills to navigate emerging challenges. Enqurious works as a strategic partner to supplement and enhance L&D Teams.
Understanding how variables work together can supercharge your marketing strategy.

Marketing Effectiveness: Strategies, Channels, and ROI Maximization

The transformative journey of the energy sector: from outdated practices to a data-driven revolution.

Enhancing Readability for Effective Learning and Development

Thoughtfully crafted instruction design with drops of ambiguity and room for creative thinking makes the learning experience more enjoyable and “real world”.

Even after putting the best of the content, infrastructure and people, the gap between the intention of organizations to foster a culture of learning and the actual implementation and adoption of learning initiatives by employees keeps on widening.

Understanding why it is so important to nurture self driven learners in a fast paced technology world

Leveraging data to design better and efficient L&D strategy for organization success